Stanの練習
指数減衰中に処理をすることで回復過程に切り替わる経時パターン。 おもに知りたいのは、
- 処理の効果が生じる時点:
t_cp - 減衰・回復の時定数:
k_dec・k_inc
実験上ではt_cp以前に処理を行っており、‘時間遅れののちに効果が見られたのだろう’という想定。
library(tidyverse)
library(knitr)
library(rstan)
## Loading required package: StanHeaders## rstan (Version 2.17.3, GitRev: 2e1f913d3ca3)## For execution on a local, multicore CPU with excess RAM we recommend calling
## options(mc.cores = parallel::detectCores()).
## To avoid recompilation of unchanged Stan programs, we recommend calling
## rstan_options(auto_write = TRUE)##
## Attaching package: 'rstan'## The following object is masked from 'package:magrittr':
##
## extract## The following object is masked from 'package:tidyr':
##
## extractlibrary(bayesplot)## This is bayesplot version 1.5.0## - Plotting theme set to bayesplot::theme_default()## - Online documentation at mc-stan.org/bayesplotrstan_options(auto_write = TRUE)
options(mc.cores = parallel::detectCores())
theme_set(theme_grey())
color_scheme_set()元データ作成
Stanでパラメータを推定する対象となる既知データセットを作成。 減衰が生じないnegative control (NC)、減衰が生じるpositive control (PC)、減衰中に回復処理をしたrecovery treatment (RT) を準備。
# 真のパラメータを与える
time <- seq(0, 15, length.out = 60)
sigma <- .05
y_max <- 1
y_min <- .3
t_cp <- 3.3
k_dec <- .41
k_inc <- .23
amp_inc <- .45

NC <- rep(y_max, length(time))
PC <- y_min + (y_max - y_min) * exp(- k_dec * time)
RT_dec <- # gross decrease
  c(y_min + (y_max - y_min) * exp(- k_dec * time))
RT_inc <- # gross incrase
  c(numeric(sum(time < t_cp)), # before the changing point
    amp_inc * (1 - exp(-k_inc * (time[time > t_cp] - t_cp)))) # after the changing point
RT <- RT_dec + RT_inc # net change

add_noise <-
  function(x, sd) x + rnorm(length(x), 0, sd)

set.seed(2018060002)

ddd <-
  tibble(NC, PC, RT, t = time) %>%
  gather(treatment, value, -t) %>%
  bind_rows(., ., ., .) %>% # N = 4にしておく
  mutate(value = add_noise(value, sigma)) # ノイズを足す
元データを図示。 破線が真の処理効果。
ddd %>%
  ggplot(aes(t, value, col = treatment)) +
  geom_point() +
  geom_smooth(method = "loess") +
  geom_line(data = tibble(t = time, value = RT_inc), col = "blue", linetype = 2)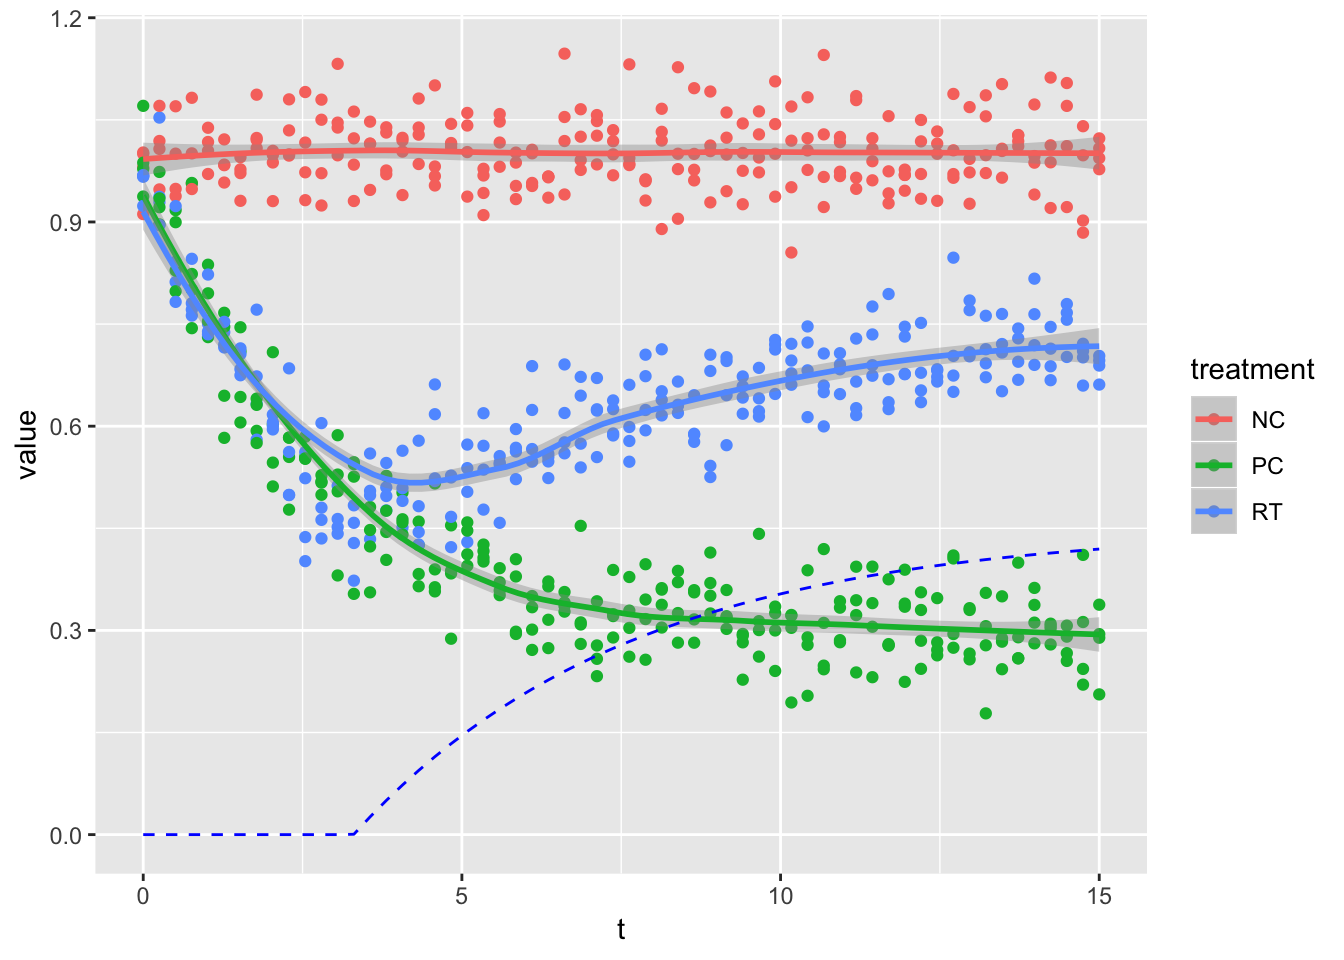
当然ながらloess回帰だと、効果の現れはじめはわからない。
モデル作成
Stanコードを書く。 treatmentで場合わけし、回復処理区 (RT) ではt_cp以前か以降かでもう一度場合わけして対数尤度を加算する。 generated quantitiesブロックで1単位時間ごとの事後分布を作成する。
data{
  int N;
  vector[N] t;
  vector[N] y;
  vector[N] trtm; // 1: Negative ctrl, 2: Positive ctrl, 3: Recovery treatment
}

parameters{
  real<lower=0,upper=1> sigma; // common sd
  real<lower=0,upper=2> k_dec; // time-constant for decrease
  real<lower=0,upper=2> k_inc; // time-constant for recovery
  real<lower=0> y_max; // upper
  real<lower=0> y_min; // lower
  real<lower=0> amp_inc; // amplitude of the recovery
  real<lower=0> t_cp; // time at the changing point
}

model{
  for(i in 1:N){
    if(trtm[i] == 1){ // for NC
      target += normal_lpdf(y[i] | y_max, sigma);
    } else if(trtm[i] == 2){ // for PC
      target += normal_lpdf(y[i] | y_min + (y_max - y_min) * exp(-k_dec * t[i]), sigma);
    } else { // for RT
      if(t[i] <= t_cp){ // before the changing point
        target += normal_lpdf(y[i] | y_min + (y_max - y_min) * exp(-k_dec * t[i]), sigma);
      } else { // before the changing point
        target += normal_lpdf(y[i] | y_min + (y_max - y_min) * exp(-k_dec * t[i]) + amp_inc * (1 - exp(-k_inc * (t[i] - t_cp))), sigma);
      }
    }
  }
}

generated quantities{
  vector[16] PC;
  vector[16] NC;
  vector[16] RT;

  for(i in 1:16){
    NC[i] = normal_rng(y_max, sigma);
    PC[i] = normal_rng(y_min + (y_max - y_min) * exp(-k_dec * (i - 1)), sigma);
    RT[i] = normal_rng(y_min + (y_max - y_min) * exp(-k_dec * (i - 1)), sigma);
    if((i - 1) > t_cp)
      RT[i] += amp_inc * (1 - exp(-k_inc * ((i - 1) - t_cp)));
  }
}
MCMC
Rからキックする。
fit_exp <-
  ddd %>%
  mutate(treatment = as.numeric(as.factor(treatment))) %>% # treatmentを数値に変換
  list(N = nrow(.), t = .$t, y = .$value, trtm = .$treatment) %>%
  stan(file = "~/Dropbox/page/data/stan_code/down_up/changing_exponential.stan", data = .)
数値を確認する。
summary(fit_exp)$summary %>%
  data.frame %>%
  head(10) %>%
kable| mean | se_mean | sd | X2.5. | X25. | X50. | X75. | X97.5. | n_eff | Rhat | |
|---|---|---|---|---|---|---|---|---|---|---|
| sigma | 0.0516255 | 0.0000227 | 0.0013334 | 0.0490849 | 0.0507127 | 0.0516118 | 0.0525068 | 0.0542605 | 3458.780 | 1.0001335 |
| k_dec | 0.4223187 | 0.0002589 | 0.0113305 | 0.4003830 | 0.4147646 | 0.4219940 | 0.4298440 | 0.4446218 | 1915.992 | 1.0001087 |
| k_inc | 0.2392567 | 0.0005629 | 0.0236947 | 0.1945554 | 0.2229001 | 0.2383920 | 0.2548892 | 0.2867336 | 1771.598 | 1.0012761 |
| y_max | 1.0014021 | 0.0000508 | 0.0032154 | 0.9950068 | 0.9993042 | 1.0014212 | 1.0035591 | 1.0077586 | 4000.000 | 1.0000981 |
| y_min | 0.2994225 | 0.0001076 | 0.0049624 | 0.2896631 | 0.2961762 | 0.2992971 | 0.3027477 | 0.3094699 | 2125.777 | 0.9995200 |
| amp_inc | 0.4496617 | 0.0003892 | 0.0161762 | 0.4198372 | 0.4382901 | 0.4490005 | 0.4599044 | 0.4836770 | 1727.394 | 1.0022566 |
| t_cp | 3.3069069 | 0.0025848 | 0.1243521 | 3.0570757 | 3.2305581 | 3.3061561 | 3.3838614 | 3.5562398 | 2314.511 | 0.9999284 |
| PC[1] | 1.0014871 | 0.0008321 | 0.0526292 | 0.8985033 | 0.9668704 | 1.0004478 | 1.0368860 | 1.1033348 | 4000.000 | 0.9999345 |
| PC[2] | 0.7592965 | 0.0008263 | 0.0522601 | 0.6590342 | 0.7231079 | 0.7585143 | 0.7945006 | 0.8598463 | 4000.000 | 1.0003241 |
| PC[3] | 0.6007656 | 0.0008221 | 0.0508590 | 0.5034519 | 0.5663434 | 0.6010756 | 0.6344523 | 0.7012205 | 3826.970 | 0.9999686 |
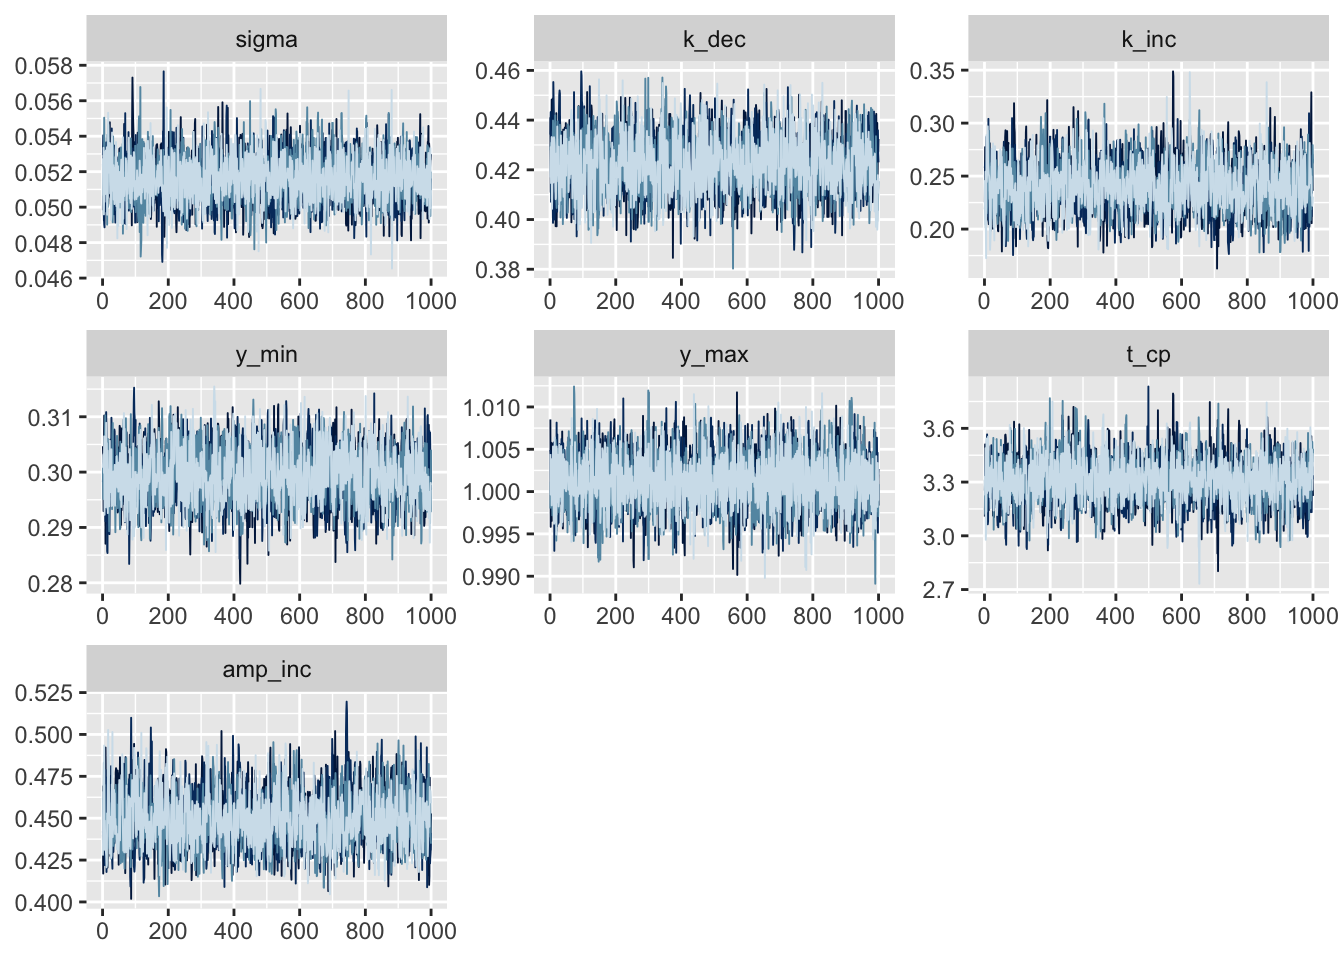
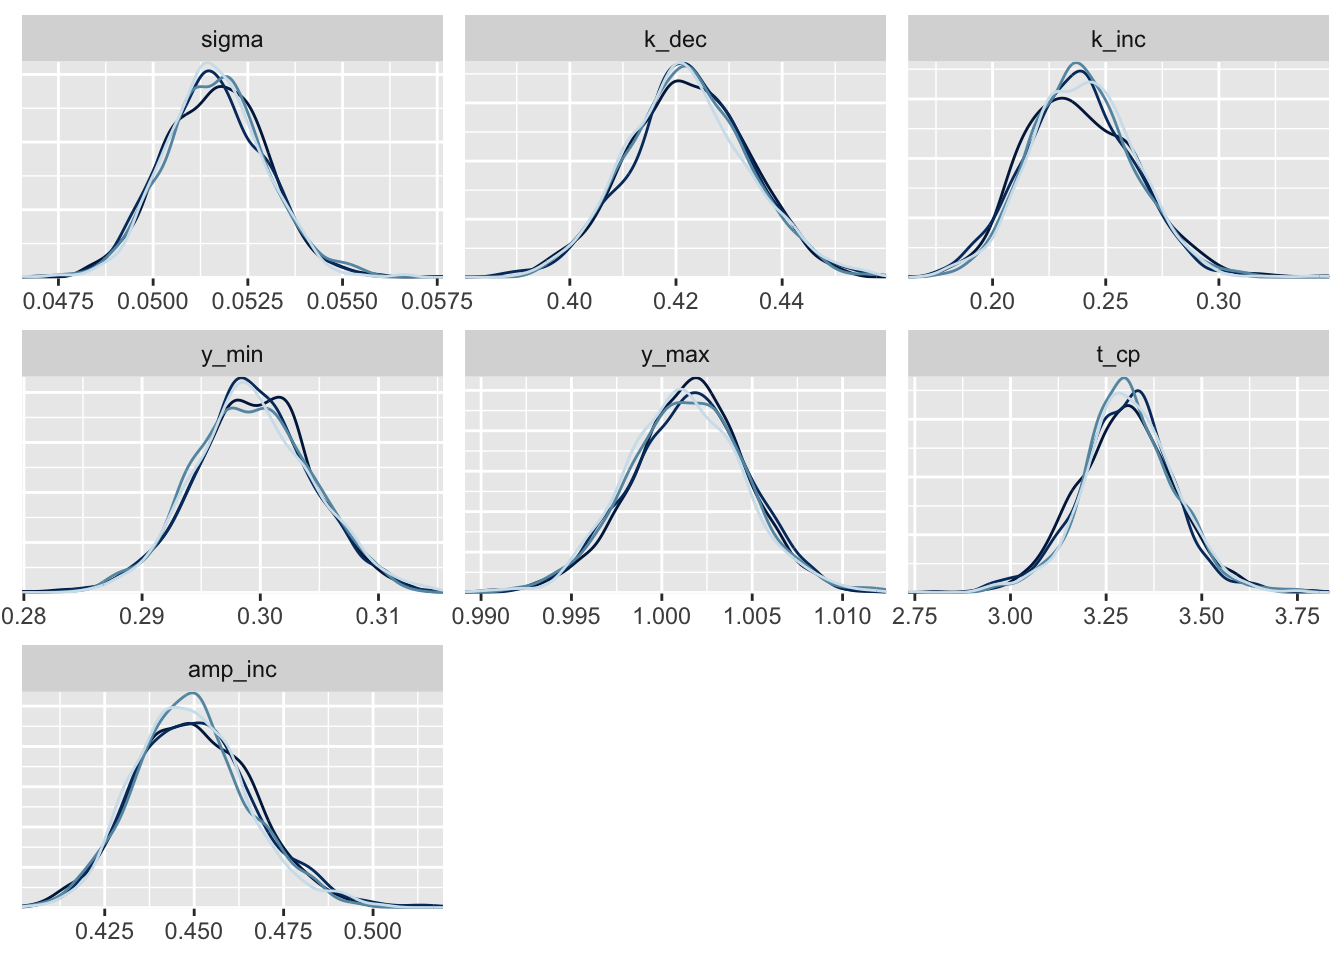
traceも目視で確認する。
pars_shown <-
  c("sigma", "k_dec", "k_inc", "y_min", "y_max", "t_cp", "amp_inc")

fit_exp %>%
  as.array %>%
  {
    print(mcmc_trace(., pars = pars_shown) + guides(col = F))
    print(mcmc_dens_overlay(., pars = pars_shown) + guides(col = F))
  }
プロット
ベイズ信頼区間を元データに足して表示する。 経時プロットに区間を追加するのがそこそこ面倒。
mcmc_sample <- rstan::extract(fit_exp)

quantile_mcmc <-
  function(mcmc_sample, probs = c(.025, .25, .50, .75, .975), ...){
    apply(mcmc_sample, 2, quantile, probs = probs) %>%
      t %>%
      as_tibble %>%
      set_names(paste0("qt", seq_along(probs)))
  }

quantiles <-
  mcmc_sample[c("PC", "NC", "RT")] %>%
  map_df(~ quantile_mcmc(.) %>% mutate(t = 0:15), .id = "treatment")

quantiles %>%
  head(10) %>%
kable| treatment | qt1 | qt2 | qt3 | qt4 | qt5 | t |
|---|---|---|---|---|---|---|
| PC | 0.8985033 | 0.9668704 | 1.0004478 | 1.0368860 | 1.1033348 | 0 |
| PC | 0.6590342 | 0.7231079 | 0.7585143 | 0.7945006 | 0.8598463 | 1 |
| PC | 0.5034519 | 0.5663434 | 0.6010756 | 0.6344523 | 0.7012205 | 2 |
| PC | 0.3968506 | 0.4645301 | 0.4982749 | 0.5329208 | 0.6011273 | 3 |
| PC | 0.3271828 | 0.3950691 | 0.4289129 | 0.4649939 | 0.5350154 | 4 |
| PC | 0.2819760 | 0.3495985 | 0.3851846 | 0.4205591 | 0.4815312 | 5 |
| PC | 0.2527515 | 0.3197507 | 0.3556679 | 0.3891363 | 0.4569490 | 6 |
| PC | 0.2333478 | 0.3029713 | 0.3369205 | 0.3726222 | 0.4391237 | 7 |
| PC | 0.2202949 | 0.2881550 | 0.3230193 | 0.3572774 | 0.4249347 | 8 |
| PC | 0.2109327 | 0.2782835 | 0.3147267 | 0.3498628 | 0.4180030 | 9 |
50%、95%ベイズ信頼区間を表示したプロット。
ddd %>%
  ggplot(aes(x = t, group = treatment, fill = treatment)) +
  geom_vline(xintercept = t_cp, linetype = 2) +
  geom_ribbon(data = quantiles, aes(ymin = qt1, ymax = qt5), alpha = .25) +
  geom_ribbon(data = quantiles, aes(ymin = qt2, ymax = qt4), alpha = .75) +
  geom_line(data = quantiles, aes(y = qt3), col = "white") +
  geom_point(aes(y = value, col = treatment), alpha = .25) +
  labs(x = "Time [hour]", y = "Parameter [unit]")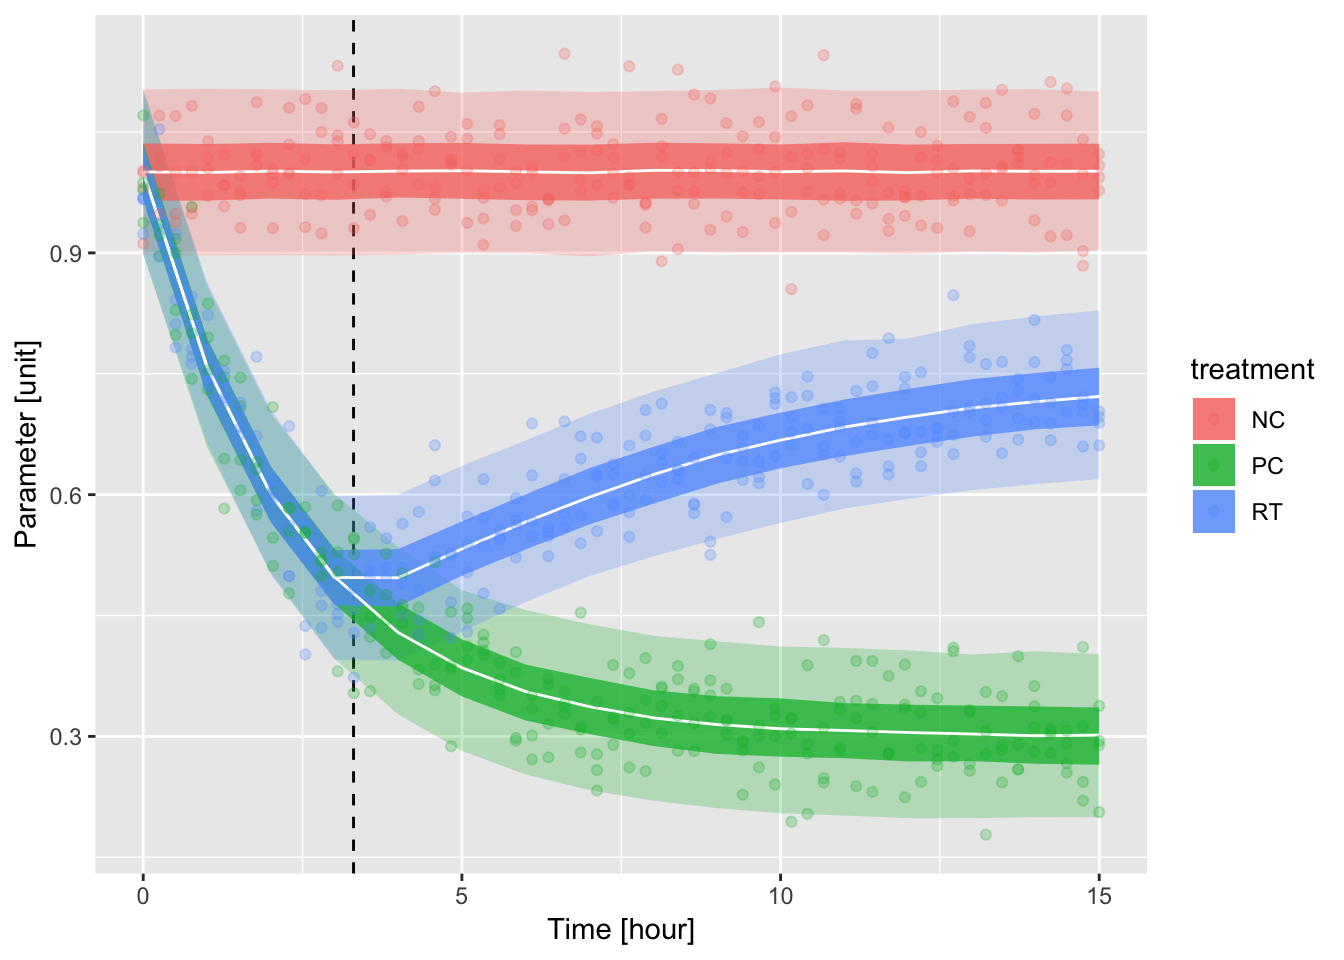
雑感
- 処理時を始点にsigmoidで組むほうが素直かもしれない
- 今回のターゲットはタンパク質なので、分解と合成に分けて微分方程式から解くべき
t_cpが小さいと2カーブの分離がうまくいかず、t_cpとk_incが不正確になる
t_cp_short <- 2.3 # changing point

RT_inc2 <- # gross incrase
  c(numeric(sum(time < t_cp_short)), # before the changing point
    amp_inc * (1 - exp(-k_inc * (time[time > t_cp_short] - t_cp_short)))) # after the changing point

RT2 <- RT_dec + RT_inc2

set.seed(2018060002)

ddd2 <-
  tibble(NC, PC, RT2, t = time) %>%
  gather(treatment, value, -t) %>%
  bind_rows(., ., ., .) %>% # N = 4にしておく
  mutate(value = add_noise(value, sigma))

fit_exp2 <-
  ddd2 %>%
  mutate(treatment = as.numeric(as.factor(treatment))) %>% # treatmentを数値に変換
  list(N = nrow(.), t = .$t, y = .$value, trtm = .$treatment) %>%
  stan(file = "~/Dropbox/page/data/stan_code/down_up/changing_exponential.stan", data = .)

fit_exp2 %>%
  as.array %>%
  .[, , c(3, 7)] %>%
  mcmc_areas() +
  geom_vline(xintercept = c(t_cp_short, k_inc), linetype = 2)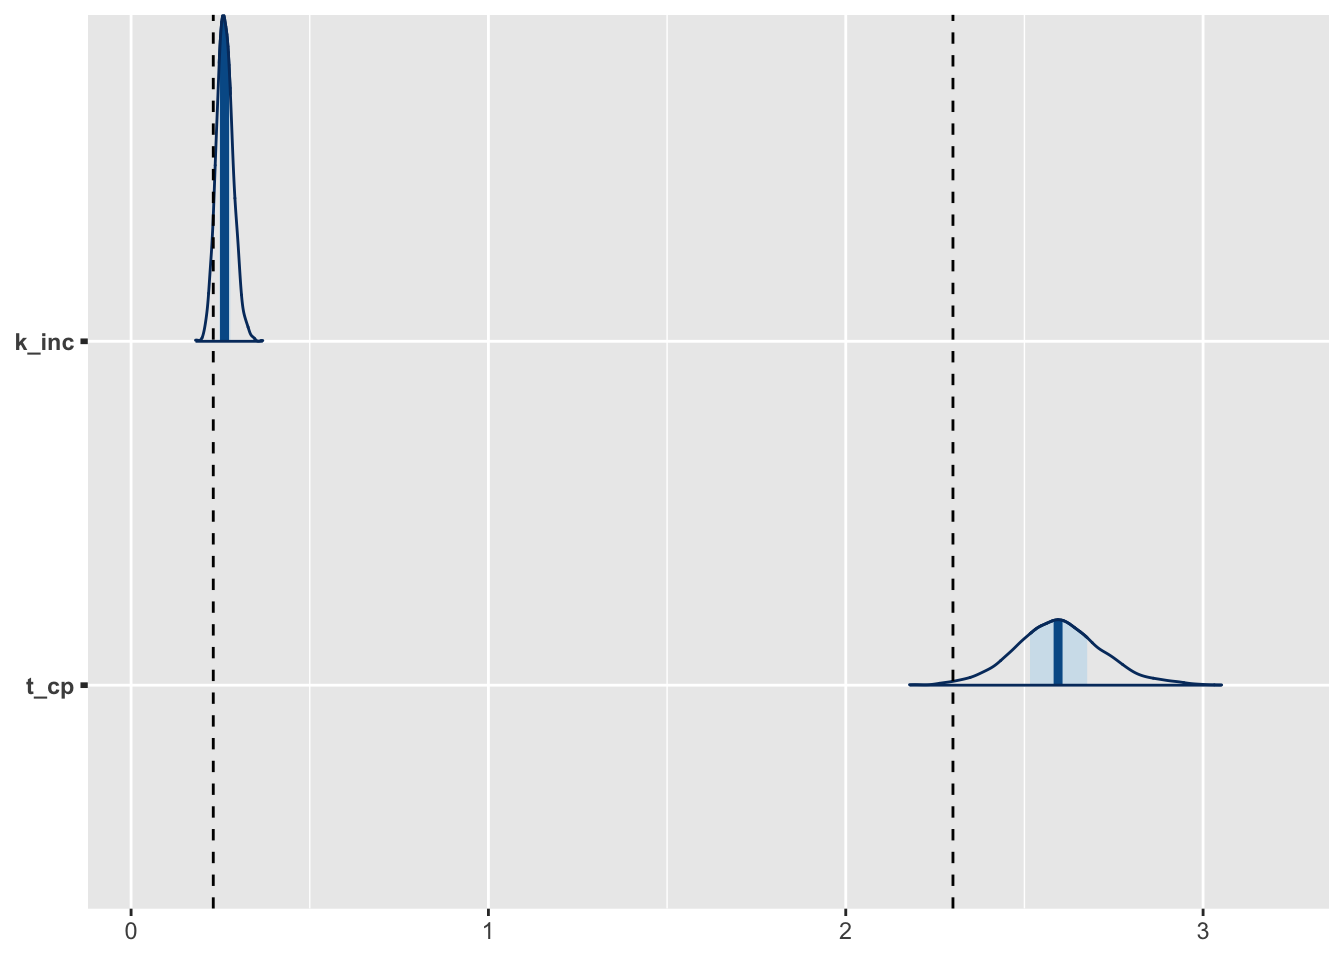
summary(fit_exp2)$summary %>%
  data.frame %>%
  head(7) %>%
kable| mean | se_mean | sd | X2.5. | X25. | X50. | X75. | X97.5. | n_eff | Rhat | |
|---|---|---|---|---|---|---|---|---|---|---|
| sigma | 0.0514300 | 0.0000217 | 0.0013720 | 0.0487630 | 0.0504732 | 0.0514218 | 0.0523452 | 0.0541451 | 4000.000 | 0.9998950 |
| k_dec | 0.4141135 | 0.0002412 | 0.0115770 | 0.3916072 | 0.4064488 | 0.4140401 | 0.4214355 | 0.4376592 | 2303.264 | 0.9998820 |
| k_inc | 0.2627310 | 0.0004925 | 0.0236050 | 0.2193719 | 0.2466110 | 0.2615057 | 0.2778788 | 0.3123580 | 2296.930 | 1.0020398 |
| y_max | 1.0011547 | 0.0000484 | 0.0030635 | 0.9951582 | 0.9990823 | 1.0011367 | 1.0032297 | 1.0070377 | 4000.000 | 1.0000442 |
| y_min | 0.2985971 | 0.0001041 | 0.0050462 | 0.2889588 | 0.2951308 | 0.2986399 | 0.3019374 | 0.3085458 | 2348.037 | 0.9997601 |
| amp_inc | 0.4433657 | 0.0002750 | 0.0129659 | 0.4198119 | 0.4345339 | 0.4428186 | 0.4517651 | 0.4706756 | 2223.558 | 1.0017751 |
| t_cp | 2.5975310 | 0.0023971 | 0.1246814 | 2.3561790 | 2.5156997 | 2.5941793 | 2.6756592 | 2.8620800 | 2705.288 | 1.0010649 |
t_cpとk_incの真値はそれぞれ、2.3と0.23。
Session Info
devtools::session_info()## Session info -------------------------------------------------------------## setting value
## version R version 3.5.0 (2018-04-23)
## system x86_64, darwin15.6.0
## ui X11
## language (EN)
## collate en_US.UTF-8
## tz Australia/Brisbane
## date 2018-06-09## Packages -----------------------------------------------------------------## package * version date source
## assertthat 0.2.0 2017-04-11 CRAN (R 3.5.0)
## backports 1.1.2 2017-12-13 CRAN (R 3.5.0)
## base * 3.5.0 2018-04-24 local
## bayesplot * 1.5.0 2018-03-30 CRAN (R 3.5.0)
## bindr 0.1.1 2018-03-13 CRAN (R 3.5.0)
## bindrcpp * 0.2.2 2018-03-29 CRAN (R 3.5.0)
## blogdown 0.6 2018-04-18 CRAN (R 3.5.0)
## bookdown 0.7 2018-02-18 CRAN (R 3.5.0)
## broom 0.4.4 2018-05-24 Github (tidyverse/broom@570b25a)
## cellranger 1.1.0 2016-07-27 CRAN (R 3.5.0)
## cli 1.0.0 2017-11-05 CRAN (R 3.5.0)
## codetools 0.2-15 2016-10-05 CRAN (R 3.5.0)
## colorspace 1.3-2 2016-12-14 CRAN (R 3.5.0)
## compiler 3.5.0 2018-04-24 local
## crayon 1.3.4 2017-09-16 CRAN (R 3.5.0)
## datasets * 3.5.0 2018-04-24 local
## devtools 1.13.5 2018-02-18 CRAN (R 3.5.0)
## digest 0.6.15 2018-01-28 CRAN (R 3.5.0)
## dplyr * 0.7.5 2018-05-19 cran (@0.7.5)
## evaluate 0.10.1 2017-06-24 CRAN (R 3.5.0)
## forcats * 0.3.0 2018-02-19 CRAN (R 3.5.0)
## foreign 0.8-70 2017-11-28 CRAN (R 3.5.0)
## ggplot2 * 2.2.1.9000 2018-05-22 Github (tidyverse/ggplot2@eecc450)
## ggridges 0.5.0 2018-04-05 CRAN (R 3.5.0)
## glue 1.2.0 2017-10-29 CRAN (R 3.5.0)
## graphics * 3.5.0 2018-04-24 local
## grDevices * 3.5.0 2018-04-24 local
## grid 3.5.0 2018-04-24 local
## gridExtra 2.3 2017-09-09 CRAN (R 3.5.0)
## gtable 0.2.0 2016-02-26 CRAN (R 3.5.0)
## haven 1.1.1 2018-01-18 CRAN (R 3.5.0)
## highr 0.6 2016-05-09 CRAN (R 3.5.0)
## hms 0.4.2 2018-03-10 CRAN (R 3.5.0)
## htmltools 0.3.6 2017-04-28 CRAN (R 3.5.0)
## httr 1.3.1 2017-08-20 CRAN (R 3.5.0)
## inline 0.3.14 2015-04-13 CRAN (R 3.5.0)
## jsonlite 1.5 2017-06-01 CRAN (R 3.5.0)
## knitr * 1.20 2018-02-20 CRAN (R 3.5.0)
## labeling 0.3 2014-08-23 CRAN (R 3.5.0)
## lattice 0.20-35 2017-03-25 CRAN (R 3.5.0)
## lazyeval 0.2.1 2017-10-29 CRAN (R 3.5.0)
## lubridate 1.7.4 2018-04-11 CRAN (R 3.5.0)
## magrittr * 1.5 2014-11-22 CRAN (R 3.5.0)
## memoise 1.1.0 2017-04-21 CRAN (R 3.5.0)
## methods * 3.5.0 2018-04-24 local
## mnormt 1.5-5 2016-10-15 CRAN (R 3.5.0)
## modelr 0.1.1 2017-07-24 CRAN (R 3.5.0)
## munsell 0.4.3 2016-02-13 CRAN (R 3.5.0)
## nlme 3.1-137 2018-04-07 CRAN (R 3.5.0)
## parallel 3.5.0 2018-04-24 local
## pillar 1.2.1 2018-02-27 CRAN (R 3.5.0)
## pkgconfig 2.0.1 2017-03-21 CRAN (R 3.5.0)
## plyr 1.8.4 2016-06-08 CRAN (R 3.5.0)
## psych 1.8.4 2018-05-06 cran (@1.8.4)
## purrr * 0.2.4 2017-10-18 CRAN (R 3.5.0)
## R6 2.2.2 2017-06-17 CRAN (R 3.5.0)
## Rcpp 0.12.17 2018-05-18 cran (@0.12.17)
## readr * 1.1.1 2017-05-16 CRAN (R 3.5.0)
## readxl 1.1.0 2018-04-20 CRAN (R 3.5.0)
## reshape2 1.4.3 2017-12-11 CRAN (R 3.5.0)
## rlang 0.2.0 2018-02-20 CRAN (R 3.5.0)
## rmarkdown 1.9 2018-03-01 CRAN (R 3.5.0)
## rprojroot 1.3-2 2018-01-03 CRAN (R 3.5.0)
## rstan * 2.17.3 2018-01-20 CRAN (R 3.5.0)
## rstudioapi 0.7 2017-09-07 CRAN (R 3.5.0)
## rvest 0.3.2 2016-06-17 CRAN (R 3.5.0)
## scales 0.5.0 2017-08-24 CRAN (R 3.5.0)
## StanHeaders * 2.17.2 2018-01-20 CRAN (R 3.5.0)
## stats * 3.5.0 2018-04-24 local
## stats4 3.5.0 2018-04-24 local
## stringi 1.2.2 2018-05-02 cran (@1.2.2)
## stringr * 1.3.1 2018-05-10 cran (@1.3.1)
## tibble * 1.4.2 2018-01-22 CRAN (R 3.5.0)
## tidyr * 0.8.1 2018-05-18 cran (@0.8.1)
## tidyselect 0.2.4 2018-02-26 CRAN (R 3.5.0)
## tidyverse * 1.2.1 2017-11-14 CRAN (R 3.5.0)
## tools 3.5.0 2018-04-24 local
## utils * 3.5.0 2018-04-24 local
## withr 2.1.2 2018-03-15 CRAN (R 3.5.0)
## xfun 0.1 2018-01-22 CRAN (R 3.5.0)
## xml2 1.2.0 2018-01-24 CRAN (R 3.5.0)
## yaml 2.1.18 2018-03-08 CRAN (R 3.5.0)